
Use Transient to inspect the ramp, hysteresis thresholds, and switched output.
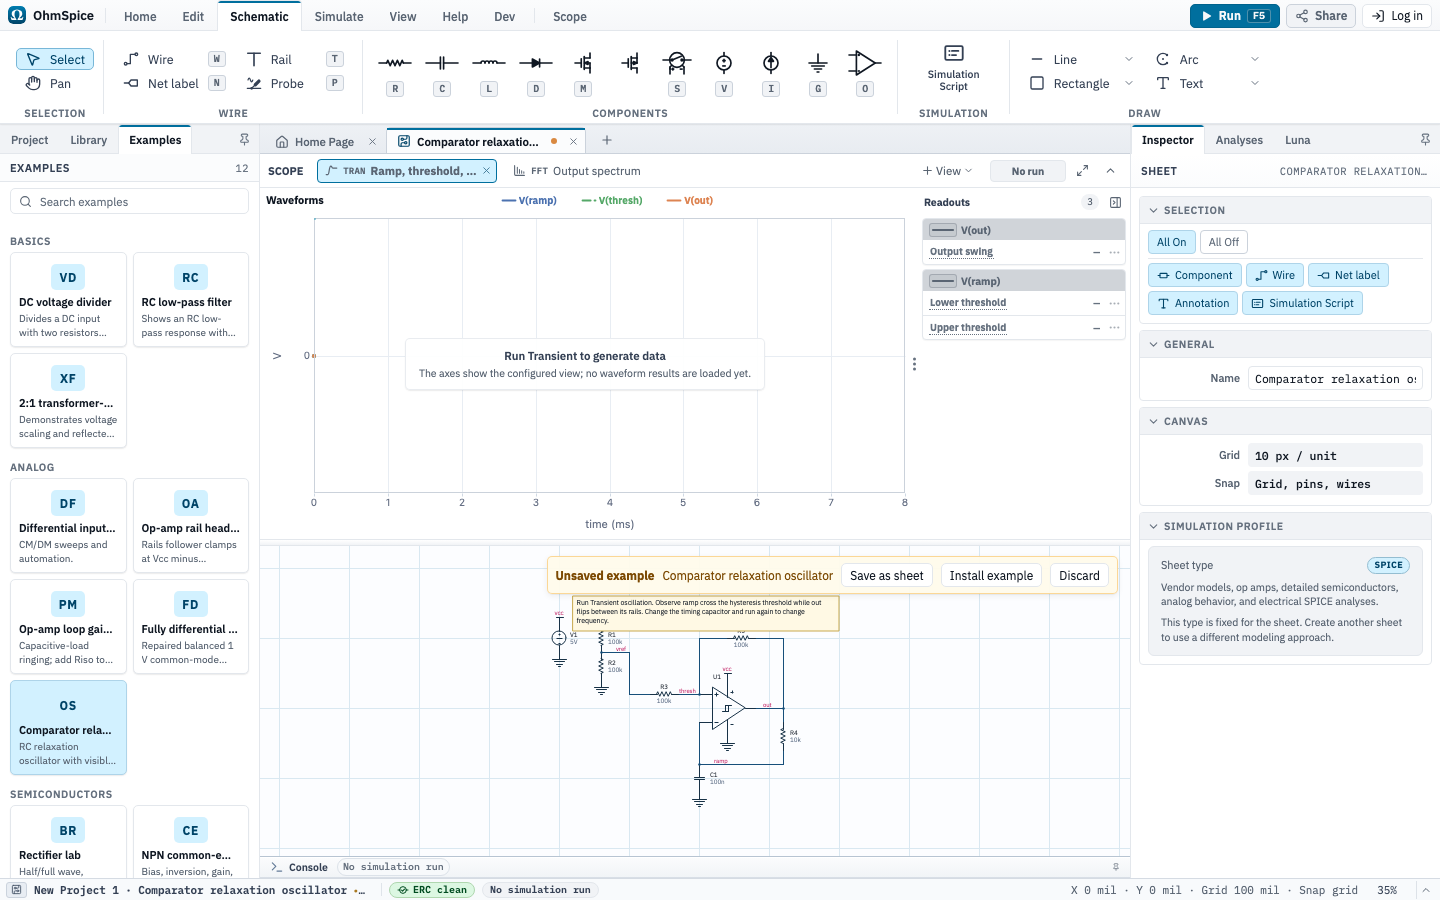
Open and run
- Open Examples from the Home ribbon.
- Choose Comparator relaxation oscillator.
- Open Simulate and choose Setup to review the analyses.
- Choose Run for one analysis or Run All for the complete configured set.
- Select a matching Scope view after the run. Use Save as sheet to keep the example or Discard to close it.
Sheets, analyses, and Scope
Comparator relaxation oscillator
Setup: Transient oscillation
| Analysis | Configuration |
|---|---|
| Transient |
|
Scope views and expected results
Ramp, threshold, and output
Analysis: Transient
Waveforms
V(ramp)V(thresh)V(out)
Readouts
- Output swingPk-Pk
V(out) - Lower thresholdMin
V(ramp) - Upper thresholdMax
V(ramp)
Python scripts
These scripts are included with the example. Review trusted project code before choosing Run.
Set oscillator frequency.py
Default sheet: Comparator relaxation oscillator
target_hz = 1000
capacitance_f = 100e-9

import math

if target_hz <= 0 or capacitance_f <= 0:
    raise ValueError("Frequency and capacitance must be positive")

# Equal 100k bias and feedback resistors; the divider adds 50k to R3.
resistance = 100e3
bias_resistance = resistance + resistance / 2
beta = bias_resistance / (bias_resistance + resistance)
# For this symmetric ideal comparator: T = 2*R4*C1*ln((1+beta)/(1-beta)).
timing_resistance = 1 / (2 * target_hz * capacitance_f * math.log((1 + beta) / (1 - beta)))
sheet = get_sheet("Comparator relaxation oscillator").override(
    R1=resistance, R2=resistance, R3=resistance, R5=resistance,
    R4=timing_resistance, C1=capacitance_f,
)
print(f"Target: {target_hz:g} Hz; R4={timing_resistance / 1000:.3f} kohm; C1={capacitance_f * 1e9:g} nF")

result = sheet.tran(8 / target_hz, step=1 / (200 * target_hz),
                    max_step=1 / (200 * target_hz), uic=True,
                    save=["V(out)", "V(ramp)", "V(thresh)"])
output = result.v("out").window(start=2 / target_hz)
crossings = output.crossings((output.min() + output.max()) / 2, edge="rising")
if len(crossings) < 2:
    raise ValueError("No steady oscillation found; try a lower target frequency")
measured_hz = (len(crossings) - 1) / (crossings[-1] - crossings[0])
print(f"Measured: {measured_hz:.1f} Hz")

fig, ax = subplots(1, 1, title="Oscillator frequency design")
ax.set(xlabel="Time", xformat="time", ylabel="Voltage (V)")
for node in ["out", "ramp", "thresh"]:
    ax.plot(result.v(node), label=node)
fig.show()