
View each analysis in Scope
- Select Run or Run All. A single analysis uses Run; multiple analyses can run together with Run All.
- Select a Scope view chip to inspect that analysis result.
- Use Signals or probe the schematic to add signals to the selected compatible view.
- Select Scope + View to add another view for a specific analysis.
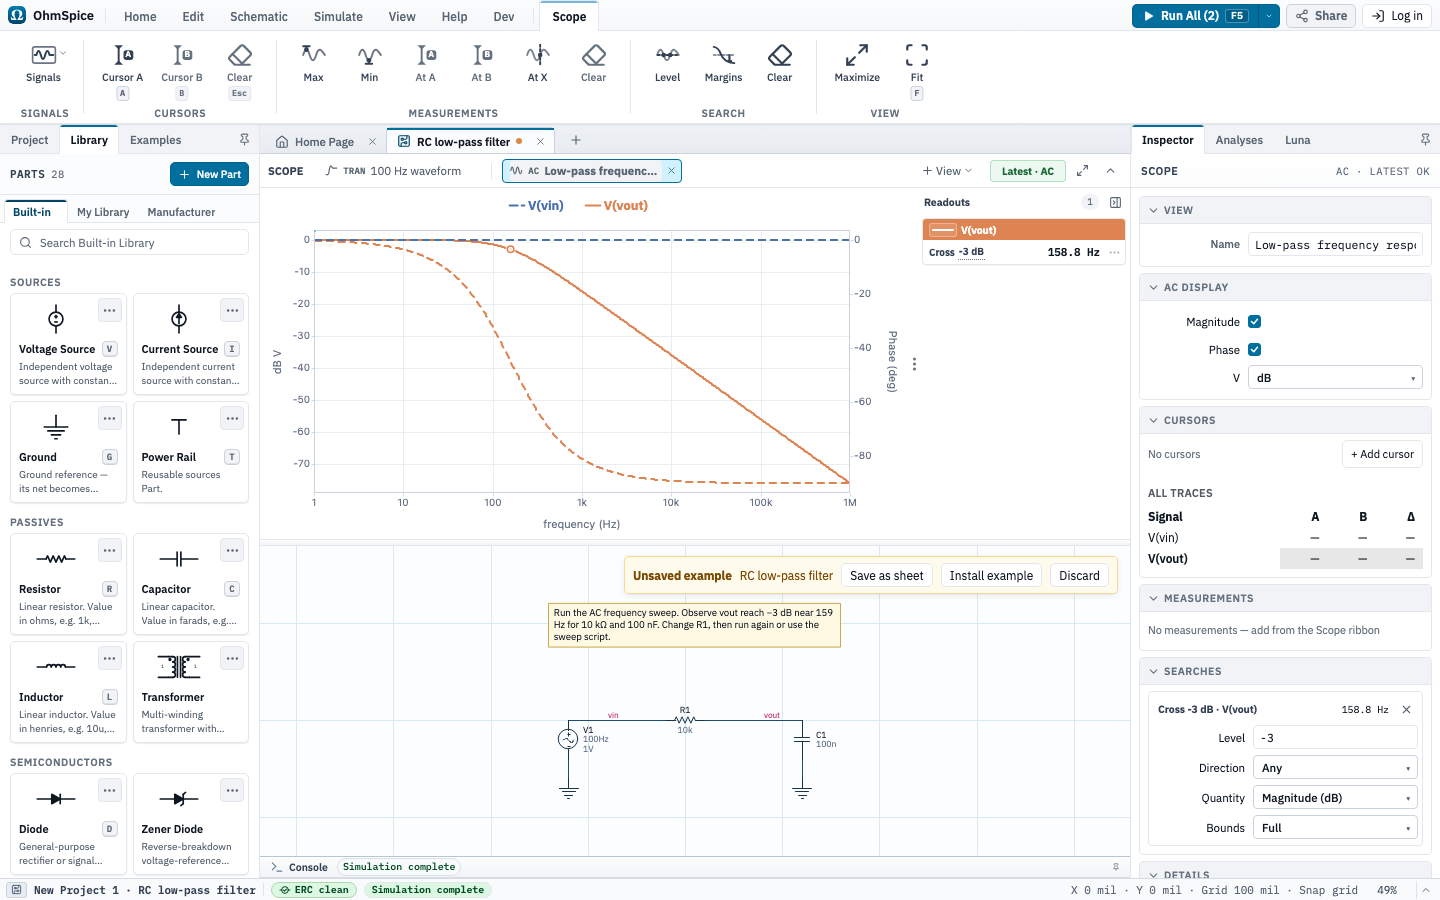
Each view keeps its own signals, zoom, cursors, and readouts. Running a simulation updates that analysis’s view without switching away from the view you are inspecting. AC Response coordinates magnitude and phase in one view; use AC Display in the Scope inspector to hide magnitude or phase when you want the other plot to use the full height. Bias Point uses a table.
Add and arrange signals
- Run a graphical analysis, then select its Scope view.
- Use Signals or probe the schematic to add a signal.
- Use a signal's menu to move it to another pane or create a new pane.
- Open the Scope Inspector and expand Plots to edit pane titles, axes, ranges, and scale modes.
Stacked panes share one horizontal domain. Zooming or panning one pane keeps the same time or frequency position in every pane. Pane heights divide the available Scope height evenly and use vertical scrolling when the plots reach their minimum readable height.
Read values across panes
Move the pointer over a chart to show its local horizontal and vertical guides. The vertical guide continues through the other stacked panes. Cursor A and Cursor B also span the coordinated view. Their intersection markers follow the selected signal, and their readout reports the sampled values and differences.
Use Fit or press F while Scope is focused to restore the full view. Right-click a chart coordinate to place a cursor at that position. Right-click elsewhere in Scope to open the same view and export commands without assigning an unrelated chart coordinate.
Read electrical traces
Capacitor voltage and inductor current remain continuous between switching events. Algebraic node voltages and currents through resistive or source branches can change at an event when the circuit permits it. Use the trace label and unit to identify each electrical measurement.
Calculate and measure signals
Open Signals and use the Math section to add an expression such as V(out) / I(R1). Math signals supportV(net), I(component), parentheses, and+ - * /. OhmSpice keeps common electrical units such as watts, ohms, siemens, and unitless ratios when it can infer them.
- Use Measurements for saved values such as average, RMS, minimum, maximum, and frequency. Place the requested cursor first when a measurement uses Cursor A or the interval from A to B.
- Use At X to read a signal at a specific time, frequency, or sweep value.
- Use Level to find crossings of a chosen signal level.
- In an AC view, use Margins to calculate gain crossover, phase margin, phase crossover, and gain margin for a loop-gain trace.
Measurements and searches stay with the Scope view. Edit a plotted expression by double-clicking its legend entry or choosingEdit expression from its menu.
Create a Spectrum view
- In a Transient Scope view, place Cursor A and Cursor B around the interval you want to analyze.
- Open Scope + View. For a complete transient, choose the option beginning New Spectrum: Full run; for the interval between two cursors, choose the option beginning New Spectrum: Between A and B.
- The new view starts empty. Use Signals in the Scope ribbon to add the transient signals you want; each renders as its FFT.
- Use Interval in the Spectrum Inspector to switch between the full run and a time window. Between A and B uses the cursor positions as the initial start and stop times.
- The Spectrum legend supports the same labels, colors, line styles, visibility, and removal controls as other plots.
- Use the Spectrum inspector to select Hann or Rectangular windowing, RMS or Peak amplitude, linear or logarithmic frequency, and linear or dB amplitude.
Spectrum is transient-only and does not rerun the circuit. It resamples variable-step transient data onto a uniform time grid before calculating an FFT for each signal. The Sampling section reports the sample rate, physical resolution, bin spacing, Nyquist frequency, and any interpolation warning. Zero padding creates denser plotted bins but does not improve the physical resolution.
Spectrum math is evaluated directly on the frequency axis after the FFT. Use f for frequency in hertz. For example,100m * (f / 1k) draws a sloped limit line in the primary Spectrum axis unit. Math overlays use the same legend, styling, cursors, and export behavior as signal spectra.
Use Peak, Fundamental,Harmonic, and THD in the Scope ribbon to add saved Spectrum readouts. Right-click anywhere in Scope to reset zoom or export CSV and PNG output.
Choose an FFT window
| Window | Use it when | Tradeoff |
|---|---|---|
| Hann | The interval does not contain an exact whole number of cycles. | Lower leakage and amplitude error, with wider effective resolution. |
| Rectangular | The interval is coherent or you need a DC level confined to one bin. | Narrower bins, with more leakage for off-bin tones. |
RMS is the default amplitude mode. A sine tone reads its RMS amplitude; DC remains equal to its DC value. Enable Remove mean (DC)only when subtracting the interval average matches the measurement you intend to make.
Choose an AC magnitude display
Each AC magnitude axis can display dB, logarithmic magnitude, or linear magnitude. Linear and logarithmic modes retain the expression's physical unit. dB labels identify the reference quantity, such as dB V,dB A, dB Ω, or dB W. A unitless transfer ratio uses dB.
Voltage, current, impedance, admittance, and other amplitude quantities use 20 log10 relative to one native unit. Power expressions with a watt unit use 10 log10(P / 1 W). For example, an AC power magnitude of 10 W displays as 10 dB W, while a voltage magnitude of 10 V displays as 20 dB V.
Export the view
Right-click anywhere in the expanded Scope area. ChooseExport CSV for plotted samples, Export PNGfor the complete chart view, or Copy image when the browser supports image clipboard access. Point-specific cursor actions are enabled only when the menu opens over a chart coordinate.